| 1.b |
BUSCO |
|
This creates short_summary.txt. »> Tip: Run generate_plot to create a graph of the summary. «< |
| 2.a |
salmon |
use –gcBias, –seqBias and –validateMappings |
Output directory has quant.sf file. |
| 2.b |
python script |
Highest Isoform for each gene |
1. Apply this filter to the quant.sf file and collect the transcript ids. 2.Then get the sequences of the collected transcripts from the fasta file. |
| 2.c |
BUSCO |
|
This creates short_summary.txt. »> Tip: Run generate_plot to create a graph of the summary. «< |
| 3.1.a |
cd-hit-est |
-c 0.95 |
This clusters 95% similar transcript sequences together in the transcriptome file and creates a non-redundant sequence file |
| 3.1.b |
BUSCO |
|
This creates short_summary.txt. »> Tip: Run generate_plot to create a graph of the summary. «< |
| 3.2.a |
TransDecoder.LongOrfs |
> 200bp |
This creates 4 files. A cds file, a pep file, a gff file and a bed file. |
| 3.2.b |
BLASTP |
-max_target_seqs 1, -outfmt 6, -evalue 1e-5 |
This gives the homologous sequences between T. castaneum and the target species |
| 3.2.c |
TransDecoder.Predict |
–retain_blastp_hits blastp.outfmt6 |
This creates 4 files. A cds file, a pep file, a gff file and a bed file. |
| 3.2.d |
BUSCO |
|
This creates short_summary.txt. »> Tip: Run generate_plot to create a graph of the summary. «< |
| 4.a |
BLASTP |
-max_target_seqs 1, -outfmt 6 |
 This would create 20 files. (5P2) This would create 20 files. (5P2) |
| 4.b |
RBBH - python script |
pull out the reciprocal best hits only. |
This would create 10 files. |
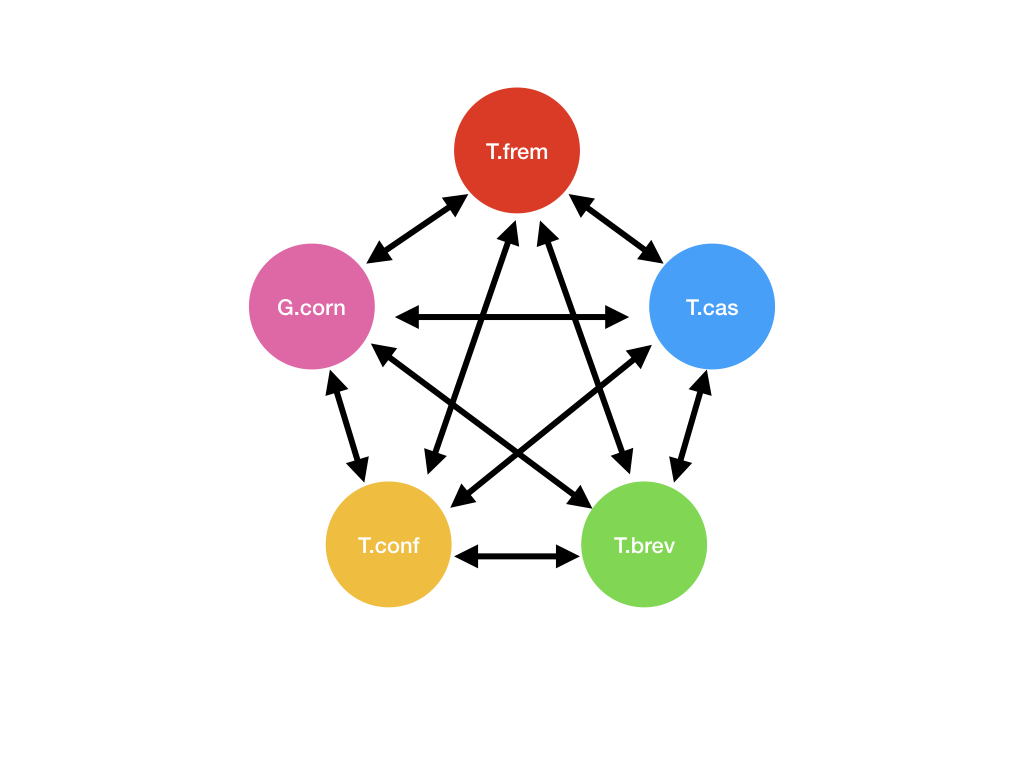
| 4.c |
Orthologs - python script |
pull out the orthologs among 5 species |
This would create 1 file and let us call this the orthologs file.» Note: The order in which you process the Best Hits file would affect the final number of orthologs.« |
| 5.a |
Annotation |
use gff file |
Add annotation to the orthologs file. |